import pandas as pd
import altair as alt
import seaborn as sns
from matplotlib import pyplot as pltIn [1]:
Data from Palmer Penguins R package
In [2]:
penguins = pd.read_csv("https://pos.it/palmer-penguins-github-csv")In [3]:
penguins.groupby("species").size().reset_index(name = "count")| species | count | |
|---|---|---|
| 0 | Adelie | 152 |
| 1 | Chinstrap | 68 |
| 2 | Gentoo | 124 |
In [4]:
colors = ["#FF8C00", "#A020F0", "#008B8B"]
sns.set_palette(colors, n_colors = 3)
In [5]:
penguins["bill_ratio"] = (
   penguins["bill_length_mm"] / penguins["bill_depth_mm"]
)
sns.displot(penguins,
            x = "bill_ratio",
            hue = "species",
            kind = "kde", fill = True, aspect = 2, height = 3)
plt.show()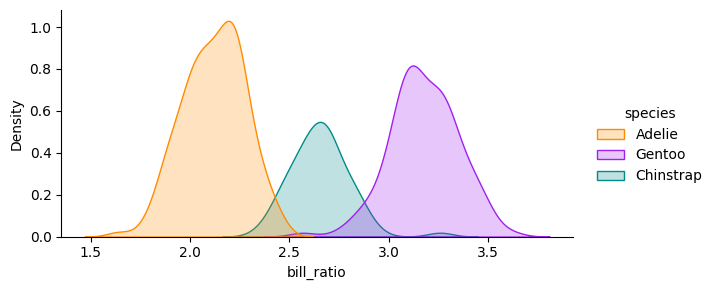
In [6]:
sns.displot(penguins,
x = "bill_depth_mm",
hue = "species",
kind = "kde", fill = True,
aspect = 2, height = 3)
plt.show()
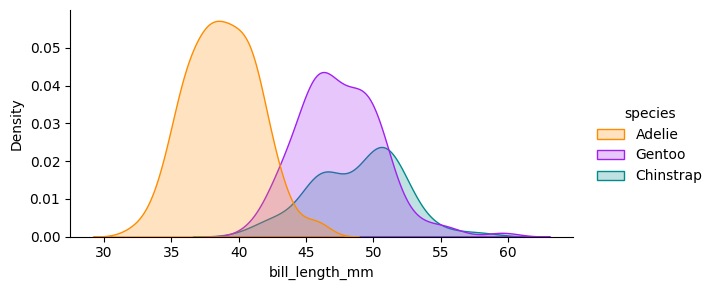
sns.displot(penguins,
x = "bill_length_mm",
hue = "species",
kind = "kde", fill = True,
aspect = 2, height = 3)
plt.show()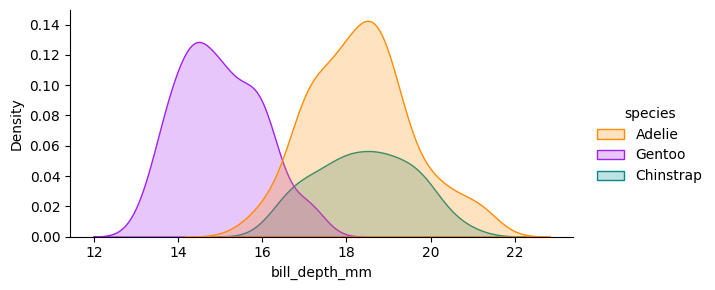
In [7]:
scale = alt.Scale(domain = ['Adelie', 'Chinstrap', 'Gentoo'],
                  range = colors)
In [8]:
alt.Chart(penguins).mark_circle(size=60).encode(
    alt.X('bill_length_mm',
        scale=alt.Scale(zero=False)
    ),
    alt.Y('bill_depth_mm',
        scale=alt.Scale(zero=False)
    ),
    color = alt.Color('species', scale = scale),
    tooltip=['species', 'sex', 'island']
)